
Introduction
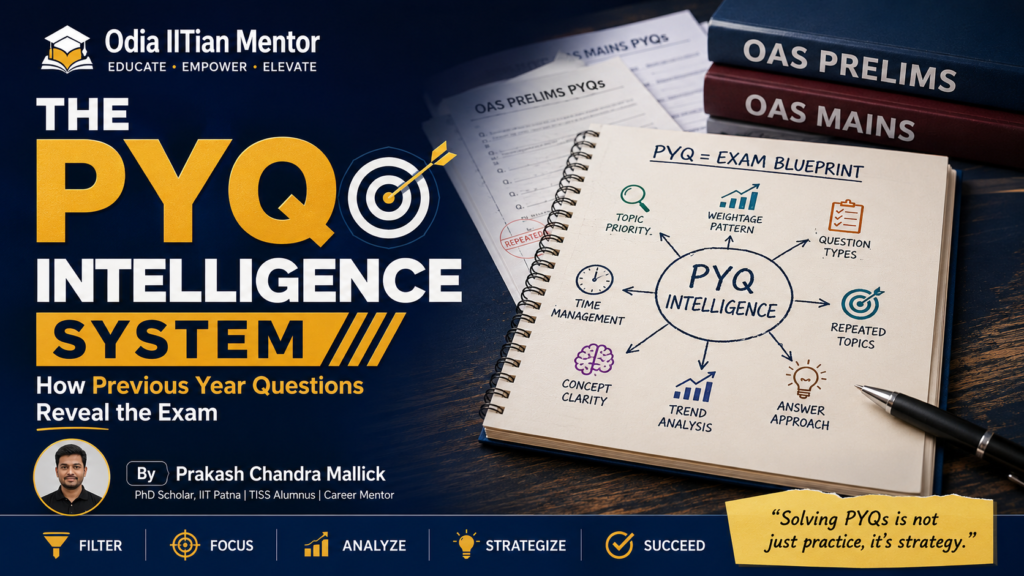
Our companion article on decoding the OAS syllabus referenced previous year questions as the evidence that turns a vague syllabus heading into a precise, weighted study priority. This article delivers the full, dedicated treatment of that promise: a complete system for treating previous year questions as intelligence about the exam itself, not simply as practice material to be solved once near the end of preparation.
Most aspirants use PYQs reactively — attempting full papers under timed conditions in the final months, checking the score, and moving on. This is genuinely useful for building exam-day stamina and pacing, covered elsewhere in this series, but it captures only a fraction of what previous papers can actually reveal when analyzed systematically from the very start of preparation.
Think of the difference this way: solving a paper tells you how you performed against the exam once. Analyzing many papers together tells you how the exam itself behaves, repeatedly, across years — a fundamentally different and considerably more valuable kind of knowledge for planning the months of preparation still ahead of you.
The Problem: Practice Material, Used Only for Practice
Solving a previous year’s paper under timed conditions tells you how you performed on that one paper. It does not, by itself, tell you which specific topics repeat most consistently across many years, which particular angle the exam favors within a given topic, or how the exam’s actual style has shifted in recent cycles. That deeper pattern only emerges when previous papers are analyzed as a connected dataset, not solved as isolated, disconnected practice tests.
The cost of skipping this analysis is significant: an aspirant can spend months studying a broad syllabus heading with relatively uniform depth and attention, never realizing that one specific sub-topic within it has appeared in some form nearly every single year, while another, equally broad-sounding sub-topic has barely appeared at all.
The P.A.S.T Framework
- P — Pattern-Map the Frequency
- A — Analyze the Question Angle, Not Just the Topic
- S — Spot the Recency Trend
- T — Translate Patterns into Targeted Practice
P: Pattern-Map the Frequency
Go through several years of previous papers and tag every single question by the specific sub-topic it belongs to, using the decoded syllabus map from our companion article as your reference structure. Once tagged, a clear frequency pattern emerges — certain sub-topics recur almost every year, others appear only occasionally, and some, despite sitting within a broad syllabus heading, essentially never get tested directly at all.
This frequency map is the single most valuable output of the entire PYQ analysis process. It converts a vague sense of “this topic seems important” into a specific, evidence-based ranking you can actually plan study time around.
A simple count is often enough to start — how many times has this specific sub-topic appeared across the years you have analyzed — without needing a more elaborate statistical treatment. The value comes from doing this consistently across the full syllabus, not from the sophistication of any single count.
A: Analyze the Question Angle, Not Just the Topic
Beyond simply noting that a topic appears, examine how it is actually asked. The same broad sub-topic might be tested through straightforward factual recall in one year, applied case-based reasoning in another, and a comparative or analytical framing in a third. This angle pattern matters as much as frequency, since it tells you not just what to study but how deeply and in what style to prepare it — pure memorization versus structured understanding capable of supporting an applied question.
A simple three-category tagging system works well for most aspirants: factual recall, applied or scenario-based reasoning, and comparative or analytical framing. Over enough tagged questions, a sub-topic’s dominant angle usually becomes clear, telling you directly whether flashcard-style memorization or structured, explanation-based practice deserves more of your preparation time for that specific sub-topic.
S: Spot the Recency Trend
Not all years of previous papers carry equal weight as evidence about the current exam. Exam patterns evolve — a shift toward more applied, analytical questions, a growing emphasis on integrating current affairs with static topics, a change in how options are structured. Weight your most recent three to five years of papers more heavily than older ones when drawing conclusions about the exam’s current style, while still using the longer historical record for the frequency analysis in the Pattern-Map step.
A practical way to apply this in your own log: mark each tagged question with its year, and when reviewing your completed analysis, read through the most recent years first and explicitly ask whether the older years’ pattern still seems to hold or whether something has noticeably shifted. Treat any genuine shift you identify as more informative about the exam going forward than the older, larger body of historical data it is updating.
T: Translate Patterns into Targeted Practice
The entire point of this analysis is to change what you actually do, not simply to produce an interesting spreadsheet. Use your frequency and angle findings to prioritize study time toward high-frequency sub-topics, to calibrate the depth and style of your preparation to match the angle pattern you have identified, and to build your own practice questions that mirror the real distribution you have found, rather than guessing at what a representative question set should look like.
Building the PYQ Analysis Habit Over Time
Rather than treating PYQ analysis as a single, large project to complete once at the start of preparation, build it into your ongoing study rhythm. As you finish studying each sub-topic from your decoded syllabus map, immediately pull the relevant previous year questions for that specific sub-topic and tag them before moving on, rather than batching the entire analysis into one separate, disconnected exercise.
This approach has a meaningful advantage over a single large analysis session: tagging questions immediately after studying the underlying material means you are evaluating each question with genuine, fresh understanding of the topic, rather than working through years of papers on subjects you have not yet studied at all, where the tagging itself becomes guesswork rather than genuine analysis.
A PYQ Analysis Log Template
A simple structure for tracking previous year questions as you work through them, rather than solving and forgetting each paper individually.
| Year | Topic | Sub-Topic | Question Angle | Notes |
| (fill in) | (fill in) | (fill in) | (fill in) | (fill in) |
| (fill in) | (fill in) | (fill in) | (fill in) | (fill in) |
| (fill in) | (fill in) | (fill in) | (fill in) | (fill in) |
Even a simple spreadsheet using these five columns, filled in consistently as you work through each year’s paper, produces a genuinely usable intelligence dataset within a few weeks — considerably more valuable than the same papers solved and set aside without this structure.
Why This Matters Specifically for OAS
OPSC’s OAS examination combines national-level subject matter with a substantial Odisha-specific component, and PYQ analysis is precisely what reveals how these two layers actually balance against each other in practice, beyond what the syllabus document alone communicates. A frequency map built across several years frequently surfaces specific Odisha-related sub-topics appearing with disproportionate regularity — exactly the kind of evidence-based finding our companion article on the Odisha Advantage treats as a genuine, identifiable scoring opportunity rather than a vague impression.
A Worked Example
Consider a composite case drawn from recurring patterns across mentoring conversations, not one identifiable individual.
An aspirant solves eight years of previous papers exclusively as timed mock tests during the final three months before the exam, checking scores afterward but never systematically tagging or analyzing the underlying questions. Preparation up to that point had been spread relatively evenly across the full decoded syllabus, with no particular sense of where genuine priority should sit.
Restarting the same eight years of papers using the P.A.S.T framework, this time early in the preparation cycle, the aspirant tags every question by sub-topic and angle. The resulting frequency map reveals that a small number of specific sub-topics — several of them Odisha-specific — account for a disproportionately large share of total questions across the full eight-year span, while several broad-sounding headings the aspirant had spent considerable time on barely appear at all. The angle analysis further reveals a clear shift toward applied, scenario-based questions in the three most recent years compared to the more purely factual style common in earlier papers. Reallocating study time and practice-question style based on this evidence produces a noticeably more targeted, confident preparation than the original, evenly spread approach.
The aspirant’s own reflection afterward was direct: the eight years of papers had been sitting on a shelf the entire time, genuinely solved and genuinely scored, yet somehow never actually read as the connected dataset they had been all along. The information had been available from the very beginning; only the analytical structure to extract it had been missing.
Common Myths Worth Retiring
- “PYQs are mainly useful for practice near the end of preparation.” Analyzed early and systematically, they reveal priorities that should shape preparation from the very beginning.
- “All years of previous papers are equally representative of the current exam.” Recent years generally carry more weight as evidence of the exam’s current style than older ones.
- “If a topic appears in the syllabus, it will be tested with roughly proportional frequency.” Actual frequency, visible only through PYQ analysis, often diverges considerably from syllabus presence alone.
- “Solving a previous paper once is enough; there’s no need to revisit it analytically.” A single timed attempt captures performance, not the deeper pattern only systematic tagging across many papers reveals.
Common Mistakes Aspirants Make With PYQ Analysis
- Treating previous papers purely as timed practice tests, without ever tagging or analyzing the underlying patterns.
- Weighting very old papers as equally informative as recent ones about the exam’s current style.
- Noting which topics appear without examining how they are actually asked.
- Producing an interesting frequency analysis and never actually changing study priorities or practice style based on it.
- Starting PYQ analysis only in the final preparation months, after study priorities have already been set by other means.
Action Steps: Apply the P.A.S.T Framework This Week
- Choose one subject and tag every question from the last five years of available papers by sub-topic, using the log template above.
- For each tagged question, note the specific angle — factual recall, applied reasoning, comparative analysis — alongside the sub-topic.
- Separate your analysis into recent years and older years, and note any clear shift in style or emphasis between the two groups.
- Identify the two or three highest-frequency sub-topics this analysis reveals, and check whether your current study time genuinely reflects that priority.
- Write one practice question in the style your analysis suggests is most common, rather than guessing at a representative format.
Reflection Questions
- Have I been using previous papers mainly for timed practice, or have I genuinely analyzed them for underlying patterns?
- Does my current study time allocation reflect actual PYQ-based frequency, or an assumption based on the syllabus document alone?
- Have I noticed any shift in the exam’s question style across recent years compared to older papers?
Key Takeaways
- Previous year questions reveal genuine frequency and weightage that the syllabus document alone cannot communicate.
- How a topic is asked matters as much as whether it appears, and this angle pattern should shape both depth and style of preparation.
- Recent years carry more weight as evidence of the exam’s current style than older papers, even though older papers remain useful for broader frequency analysis.
- PYQ analysis is only valuable when it actually changes study priorities and practice style, not when it simply produces an unused dataset.
- For OAS specifically, PYQ analysis frequently reveals Odisha-specific patterns that a generic, national-level study approach would otherwise miss entirely.
Frequently Asked Questions
How many years of previous papers should I analyze?
A useful starting range is eight to ten years for the frequency analysis, with particular attention to the most recent three to five years for understanding the exam’s current style and angle preferences specifically.
Should I rely on officially released papers only, or are compiled question banks from coaching sources reliable too?
Official papers, where available, are the most reliable source and should form the core of your analysis. Compiled question banks can supplement this but should be cross-checked for accuracy, since errors and misattributions are not uncommon in unofficial compilations.
Is it worth re-analyzing papers I have already solved once?
Yes, genuinely — solving a paper once under timed conditions and tagging it analytically afterward are two different activities serving two different purposes, and most aspirants only ever do the first one.
Does this PYQ analysis approach work the same way for Mains as it does for Prelims?
The underlying principle is the same, though Mains analysis should pay particular attention to how questions are structured and what kind of answer they expect, connecting directly to our companion article on Prelims versus Mains, since the two stages reward genuinely different preparation styles.
If a sub-topic has almost never appeared in past papers, is it safe to skip it entirely?
Treat low historical frequency as a signal to deprioritize, not eliminate entirely. A sub-topic with consistently low frequency across many years is a reasonably safe lower priority, but the exam can and does introduce previously untested angles, so a complete, deliberate skip carries more risk than a deprioritized but not entirely abandoned position.
Conclusion
Previous year questions are not simply practice material to be solved and set aside. Analyzed systematically — tagged by frequency, examined for angle, weighted by recency, and translated into genuine changes to study priority and practice style — they become the clearest available evidence of how the exam actually behaves, considerably more precise than the syllabus document alone can ever provide.
Build this analysis early, not as a final-month afterthought, and the rest of your preparation gains a level of targeted precision that an evenly spread, syllabus-only approach simply cannot match.
What to Do Next
Pair this article directly with our companion piece on decoding the OAS syllabus, since the two work as a single combined system — one defines the map, the other tells you where on that map to focus. The OAS From Zero Program at Odia IITian Mentor includes a structured, multi-year PYQ analysis you can use directly or compare against your own.
About the Author
Prakash Chandra Mallick is a Senior Educator, Senior Development Professional, and PhD Scholar at IIT Patna, with prior academic training at TISS Mumbai and the University of Hyderabad. He founded Odia IITian Mentor to bring structured, evidence-based career guidance and civil services preparation to students across Odisha, with particular attention to first-generation learners and rural and Odia-medium students who are too often left out of mainstream career advice.
https://odiaiitianmentor.com/academy